I’m definitely not the first to apply the scrum framework in research and analytics, but my web searching has come up with scant tangible examples of how practitioners like my team and I are actually using it on a day-to-day basis. That changes now!
This is the first in a series of two posts. Here, we will explore some general team-based patterns of scrumy (scrummy? definitely not scrumby, though.) behavior that I’ve used with two analytics and research teams who repeatedly beat timeline and quality expectations. The second post will get into some project-based examples to bring it home.
If you’re using scrum in this field, or really any field, please leave a success story in the comments so more folks can hear just how awesome this framework is in practice.

The principles
Before we begin, a primer on scrum. The following points come right from Sutherland and Sutherland’s (2014) The Art of Doing Twice the Work in Half the Time. If you buy only one book early in your journey to trying out scrum, this is the one. It has all the basics to get you rolling – you can save the certifications for later. Keep in mind, these bullets aren’t the “how to begin” roadmap from the book’s appendix, because, well, then you might not buy the book. Instead, these are some nuggets from the opening chapter that answer “why?”
- Keeping your head down and working on a project makes you busy, but it doesn’t make your work product effective. Actually, it’s usually the opposite, especially since the world is moving ever faster and specs and business priorities can change minute to minute. Regularly checking in with stakeholders and course correcting makes you busy and effective, which, in turn, makes you efficient since you won’t waste your time on unnecessary work. Win, win, win.
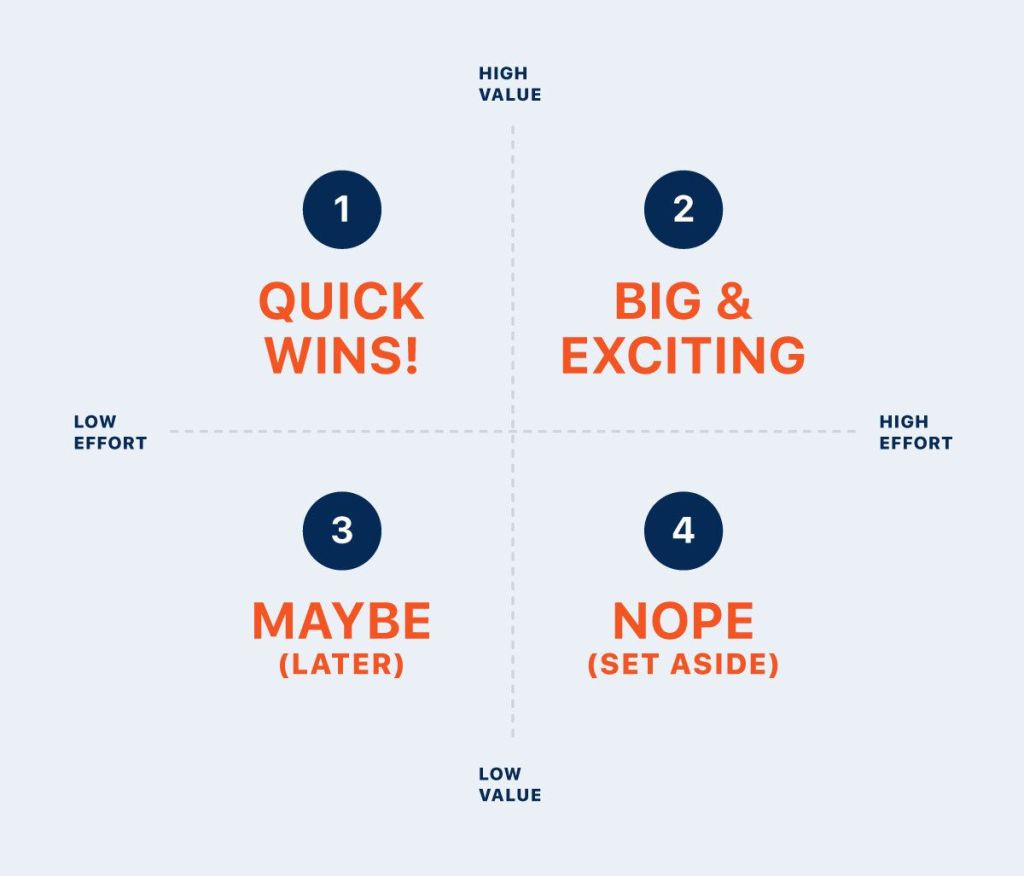
- Stakeholders want a lot. And when you deliver, they want more. (gee, thanks) Not all of their desires carry the same weight, though. In fact, 20% of a product’s features deliver 80% of the value. It’s up to you to work hard with stakeholders to figure out that 20% and to prioritize it right out of the gate.
- Lots of things can get in the way of productivity if we let them. The easiest way to bust down barriers? Don’t hold it in when you face persistent roadblocks to your and your team’s work. Talk! Share! Bust ‘em down!

Scrum comes to a team near you
I’ve collaborated with my analytics and research teams at Dallas College and Bay Path University to bring scrum approaches to organizing our work. We don’t really even talk about scrum, though, so don’t think that it has to be something super formal. It can be, but really, just try it on.
Step one: Breaking work down
Live data, disaggregation, and intersectionality. Each of these alone can be a challenge – live data is messy and pipelines can be fragile, disaggregation requires clear definitions for slicing, intersectionality raises disaggregation a power or more in complexity – and together they can be a hydra…or a chimera. Yeah, definitely a chimera. That’s the fun of business intelligence, I think, but also the challenge my teams face every day. One bite at a time, as the saying goes.
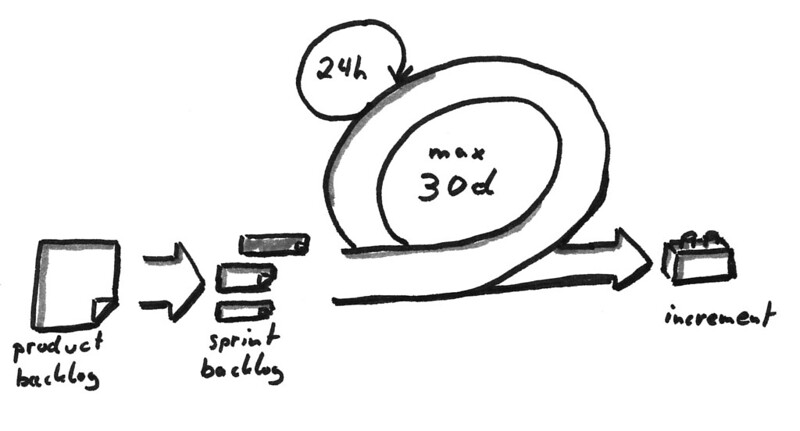
First, we think about a project like a set of Legos. What are the constituent parts? What parts have we built with before? What parts are new to us? What parts are maybe broken or missing; do we have any spares? The first step always is to make sure we have a resilient data stream and resulting model. Part of this is determining which of the required data can/not be corralled at the present time. Those elements in the second category go to the backlog. What the model looks like is the second step. It needs to fit the use cases (or user stories, if you prefer) and it needs to be extensible for when new data elements enter the picture (they almost always do).
While someone builds the model, other team members think through the sequence of business intelligence products. The first up is the component that will answer the basic question. A good example could be, “how are students progressing through early milestones in their first year.” The report or visual would answer the question for all students. Next to come out of the backlog would be a design for disaggregated looks at this data, whether by demographic characteristics or membership in a sub-population or some other specification from a use case. Each of the qualities used for disaggregation is its own project to be prioritized. Only after we have a few of the these views can we the layer in intersectionality across group memberships.
By now, the data model is ready and can be plugged into a beta business intelligence tool. We’re leveling up!

Step two: Checking in frequently
What I just described sounds kind of like a bunch of (data) scientists running around in white lab coats in a sterile environment tinkering with an experimental design. Not so much. All of this work is happening through sometimes messy prioritization conversations with stakeholders and ourselves.
The stakeholders guide us first in determining what data need to be captured by outlining the types of decisions they are confronting or the questions they are asking. This sets up very broadly the domain of the data elements to be captured, and therefore the tables and, eventually, the fields we are going to need to grab. Similarly, they let us know what breakdowns and layering they need for their analysis. Sometimes this conversation happens up front, but sometimes it happens once an initial demo is made and the stakeholder starts to imagine the other questions the tool can help answer. Regardless, this sets the scope for the underlying data joins to other data domains.
When the team is up against the challenge of poor data availability, quality, or definitions in the middle of a project, then it’s also the stakeholders who can reshuffle the priority order. It’s always better to have some data today than all the data in three months when the decision has passed us by.
[I’ll come back here some day to put in a graphic that I’m thinking through where I mash together CRISP-DM and scrum into one framework to rule them all]
The upshot here is that the stakeholder needs to be involved throughout the process. They help set the development agenda, validate the work as it unfolds, and point the direction for course corrections. Without all this engagement, the likelihood of developing a tool that is abandoned before it’s even adopted is much higher.
We also meet with ourselves. Every day. Even the meeting-averse among us will see the value, though. At the beginning of each day, the team gets on a quick video call. We schedule them for 15 minutes and there are seven of us on the call, so about 2 minutes per person if we all have something to say. The purpose of these meetings is to surface the challenges that we’re facing: What terms need defining? What table(s) and fields are the best for this query? What data are causing problems? What pipeline broke? Who has been waiting on a stakeholder? Etc., etc. We are a hive mind on these calls, each of us sharing some expertise to help the team conquer more challenging tasks. When a conversation is too long for this call or someone is struggling with some details or we need to get info from outside of the team, we take it offline for a smaller, breakout discussion before the day gets rolling. From there, the rest of the day can be maximally productive for everyone. Just be careful: these meetings, I’ve found, have a way of backsliding into what-I’m-working-on-today round robins. Those are decidedly less valuable.
Step three: Carving out time for team development
Three common challenges have presented themselves to my data teams, though there are certainly others unique to individual projects. For now, we’ll focus on the former category since I’d bet most teams struggle in these areas. Whatever the case, my teams set aside time specifically to address these roadblocks or else they end up rearing their heads again…and again…and again. Wait, maybe it is a hydra, after all…I digress.
Data availability is a broad category of issues that sound like,“we don’t have access to that data,” “those data are highly missing,” “there are two (often more) different data sources for that semantic idea,” etc. The remedies for this range from dedicated projects to building new, validated data stream; to working with data entry professionals to understand and come up with approaches to tackle data missingness at the source; and identifying which sources of data are “golden” in their provenance and lineage. I hope you’re hearing that these are all projects in their own right and the team needs to put aside time for them just like any other project.
Statements like “what does this term mean,” “what values, codes, or statuses should we use for that,” and “she means X when she says that, but he means Y” indicate questions about data definitions that can stop the team and a project in its tracks. We can make up our own definitions in the analytics office, but that just trades progress for stakeholder doubt or mistrust of the intelligence tools once they’re in circulation. Again, the best step forward is to set aside time to work with stakeholders. We collaborate on common-language and technical definitions to ensure that we pull the right data for the right question, especially since questions have a way of repeating themselves. Writing down the definitions – and sample queries – in a place for all to find (we use a collaborative OneNote notebook) effectively closes the loop to prevent future challenges.
The third category of challenge is more about technical skills. Like all specialized fields, analytics and research relies on common tool sets and those tool sets tend to evolve, or sometimes leap, in features and functions. It is critical to identify strengths and gaps at the team level since these tools and the capabilities they require are an overall portfolio. Someone who is the master of SQL or of Power BI, for example, could be tapped to stay current on new developments and to train other team members when a new development in the field will help solve a team challenge. Similarly, a gap on the team lends itself to identifying a team member to send for training so they can come back and circulate their learnings.
My team and I at Dallas College now set aside a departmental development day once every two weeks (note: this is not exactly a sprint retrospective, but sometimes it can be). Our time is spent on the kinds of activities described above that can be subsumed by the day-to-day of ad hoc requests and the project backlog. Everyone works on removing at least a part of a barrier so that we can get even better as a team immediately. Ever upward.

The upshot
The most important thing I’ve learned from using elements of the scrum framework is that it fundamentally changes a lot of things. A team functions at a higher level. Sutherland and Sutherland really weren’t exaggerating with the twice-the-work-in-half-the-time thing. But, more importantly to me, the information flow and barrier busting is the scrum-didiliumptious secret sauce (you didn’t really think you’d make it out of this article without that reference, did you?). When you close your eyes and focus, you hear a magical, mechanical whir, or a cat softly purring, depending on your preferred metaphor. Whatever the case, that’s the intangible thing we call high-functioning teamwork.
Here’s the thing, though: stakeholders change, too. It sounds funny to hear out loud, but it really has been my experience that saying the equivalent of “you want five things and the team can deliver two now and three at a later date” snaps business challenges into greater focus. I’ve been told it’s the most diplomatic way I say no, but it also facilitates stakeholders’ thought processes on what the problem is and how data can solve it. They become more expert at defining and prioritizing their own data requests. The frequent check-ins on larger projects similarly gets them reflecting along the way, driving them to refine their thinking on use cases for the analytics tools they’ve requested.
Next post we’ll see how this has panned out on some actual projects! Stay tuned.


Leave a comment